Science projects students build, not just write up
A lab write-up can be copied. A tank where the prey keeps escaping, an island that floods exactly where the student predicted, a coaster that finally makes the loop once the lift hill got taller: those have to be built, tested and explained. These three projects take a unit you already teach, adaptations, Earth's surface, energy, and turn it into a model students make and then question. Each one has a finished example you can open right now, a one-period version for trying it out, a rubric that grades the science rather than the software, and a brief you can print.
A predator and its prey
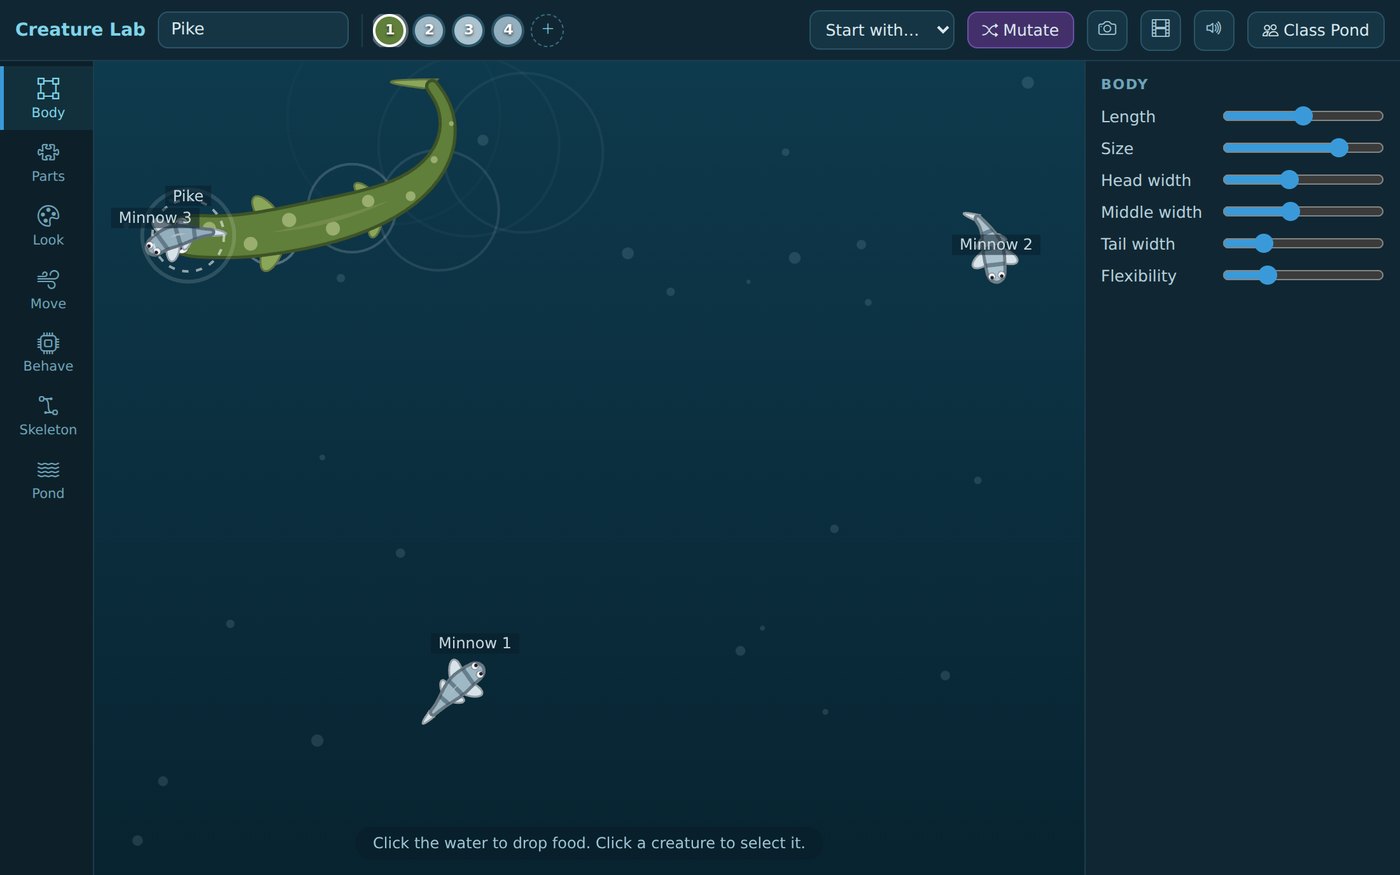
Two kinds of creature in one tank, a predator and its prey, each built for its job. Students choose body length, size, fins, speed and how bendy the body is, set who chases and who flees, then run the tank and explain who gets away and why.
The one-period version
Everyone opens the tank and watches for two minutes, counting how often the pike reaches a minnow. Then each student changes one thing about the minnows, only one, so that fewer get reached, runs it again, and explains why the change worked.
The full project
- Pick a real predator and prey from the unit and list the features that help each one survive.
- Build both in the tank: body shape, size, fins or legs, and colors, then set the predator to chase and the prey to flee.
- Run it for two minutes and count how often the predator reaches its prey. Do it three times.
- Change one feature, run it three more times, and compare the counts.
- Present the claim, the counts that back it, and what the model leaves out about the real animals.
The finished piece has to answer
- Which feature helps the prey most, and how do you know?
- What does the predator give up to be fast?
- How is your creature like the real animal, and how is it not?
What they hand in
The tank's share link and a table: the feature changed, and the counts before and after.
Grading it: the science, not the software
| Adaptations | Each feature is tied to what it does for the real animal. |
| Evidence | Counts before and after the change, from repeated runs. |
| Fair test | Only one thing changed between the two sets of runs. |
| Model limits | The student names what the model leaves out. |
What a student had to know to make this
What each feature of the real animals is for, and how to test one idea at a time. Changing one variable and counting the result is the whole method, and the tank shows the answer while they watch.
NGSS 4-LS1-1 (structures that support survival and behavior) and MS-LS2-2 (patterns of interaction between organisms, including predation), with the practice of planning and carrying out investigations. ISTE Student Standard 1.3 (Knowledge Constructor).
Flood the island
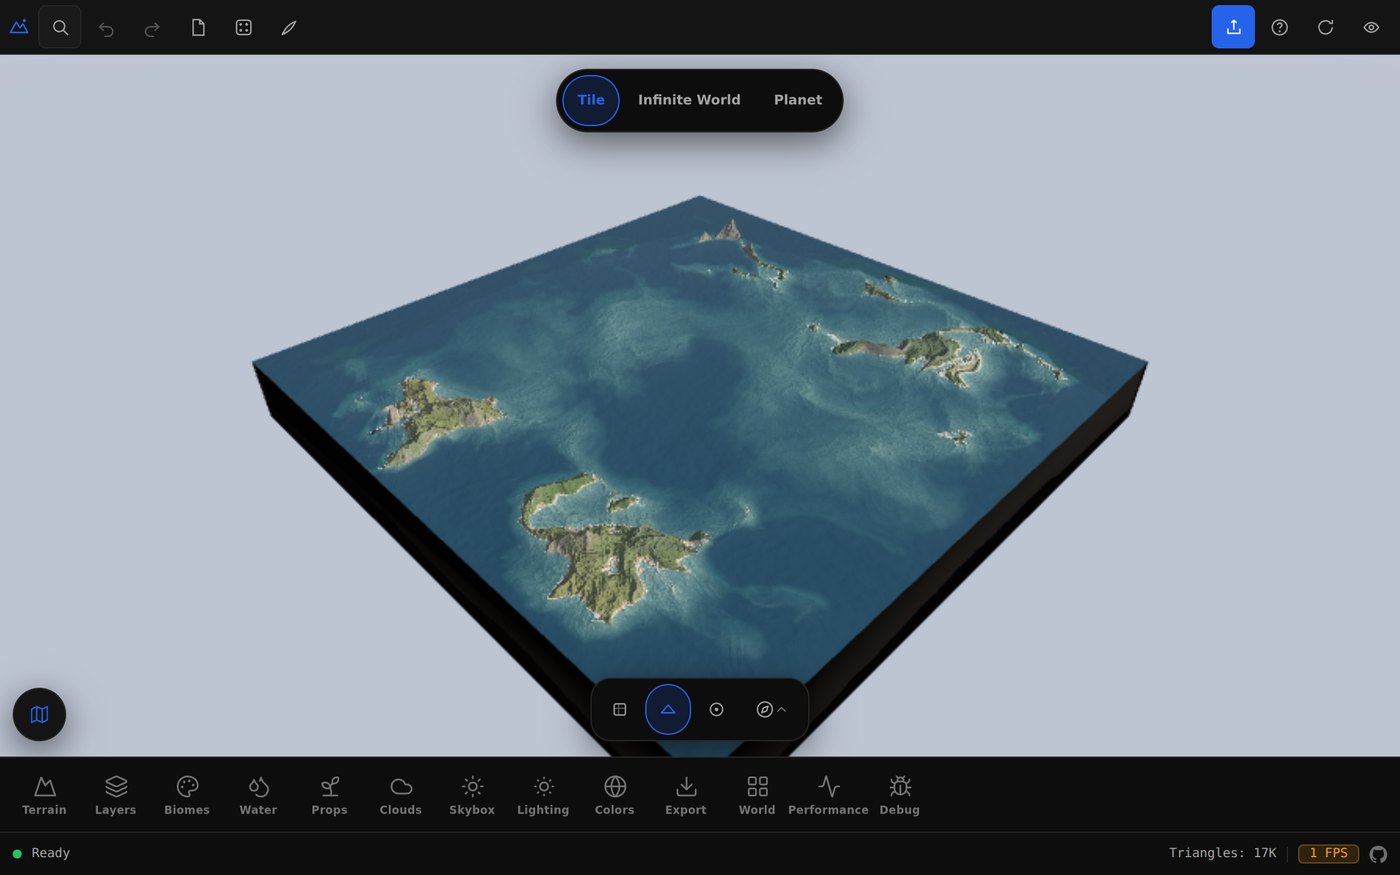
An island grown from a single number, then a rising sea around it. Students predict which places flood first, raise the sea level to find out, and explain the pattern. The same island's forests, deserts and snow follow temperature and moisture, so a second question is built in.
The one-period version
Open the flooded island, lower the sea level back to 100, and take a screenshot. Mark on it the three places you think will go under first, then raise the sea again and check. Write one sentence on what the first places to flood have in common.
The full project
- Grow an island and take a screenshot of it at the starting sea level.
- Mark on the screenshot the places you predict will flood first, before touching the sea level.
- Raise the sea in steps, taking a screenshot at each one.
- Compare the prediction with what happened, and explain it with elevation, slope and rivers.
- Find a real place with the same problem, a river delta or a low island nation, and give the source.
The finished piece has to answer
- Which places flooded first, and why there?
- What stayed dry the longest, and what do those places share?
- Which real places on Earth are most like your first-to-flood areas?
What they hand in
The island's share link, the screenshots with the prediction marked, and one paragraph comparing prediction and result.
Grading it: the science, not the software
| Prediction | Made and marked before the sea level moved. |
| Observation | A screenshot at each step, in order. |
| Explanation | Elevation, slope and rivers explain the pattern. |
| Real world | A real place is named, with a source. |
What a student had to know to make this
How elevation and landforms shape a coastline, and that rising water takes low, flat land first. A prediction written down before the test is what makes it science rather than a screenshot.
NGSS 4-ESS2-2 (analyze and interpret maps of Earth's features), with the crosscutting concept of cause and effect. ISTE Student Standard 1.3 (Knowledge Constructor).
Energy on the track
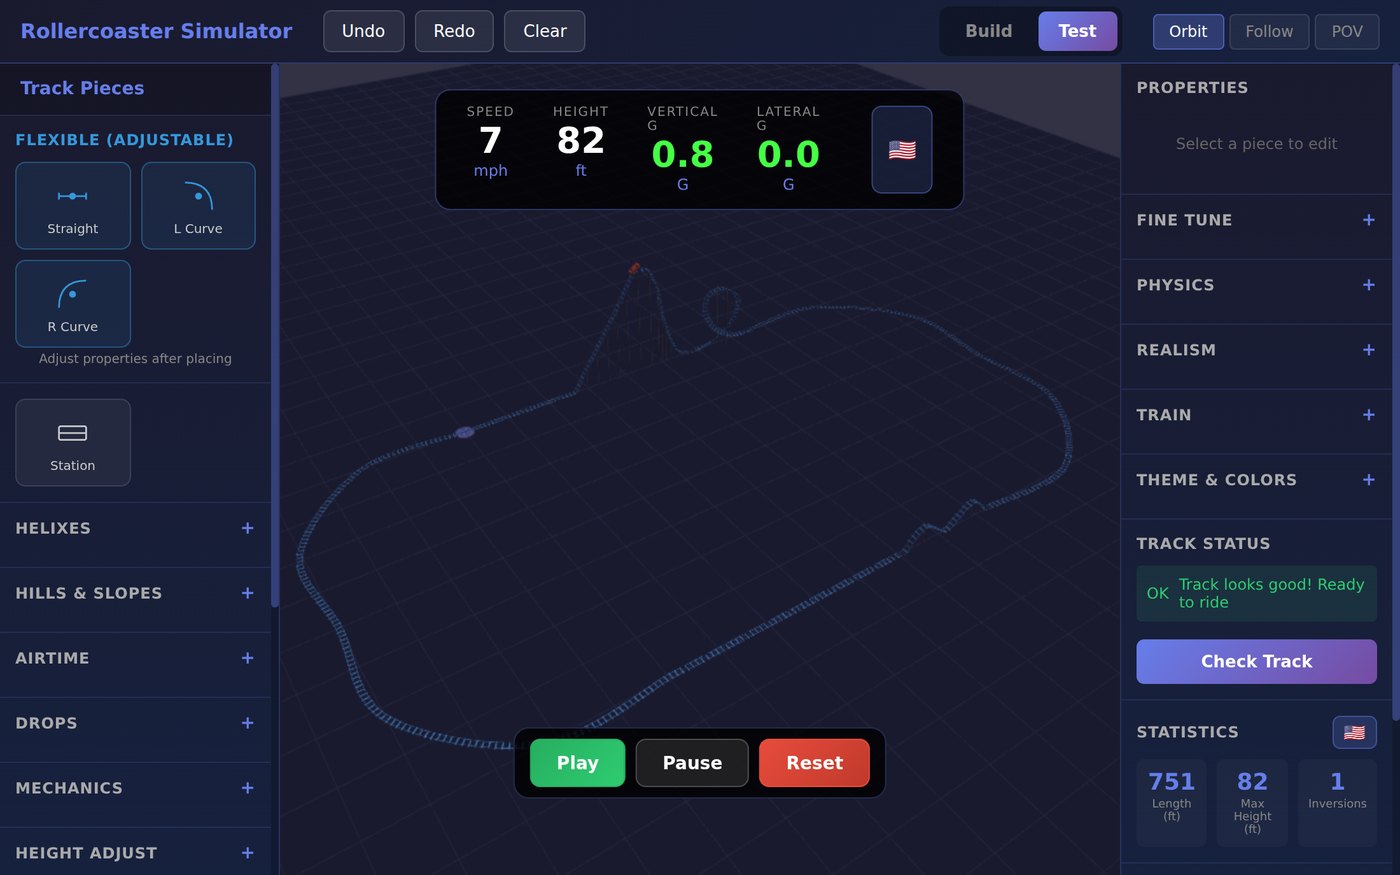
A roller coaster that has to work: the train needs enough speed for every loop and hill. Students predict the speed at the bottom of each drop from its height, check it against the live readout, and explain where the missing energy went.
The one-period version
Open the coaster, press Test, then Play, and write down the height at the top of the lift and the speed at the bottom of the first drop. Then turn the friction up under Physics and ride again. What changed, and why?
The full project
- Build a coaster with a lift hill, a big drop and a loop.
- Before riding, predict the speed at the bottom of the drop from its height. Middle school: taller drop, faster train. High school: use the energy equation.
- Ride it and record height and speed at five points around the track.
- Compare prediction and measurement, and explain the difference with friction.
- Make the loop fail on purpose by lowering the lift, see what Check Track says, then fix it.
The finished piece has to answer
- Where does the train have the most potential energy, and where the most kinetic energy?
- Why is the measured speed lower than the prediction?
- What is the lowest lift hill that still gets the train around the loop?
What they hand in
The coaster's share link and a table of predicted and measured speeds, with the explanation.
Grading it: the science, not the software
| Prediction | Made from the height before riding, with the reasoning shown. |
| Data | Heights and speeds recorded at several points. |
| Explanation | Energy transfer and friction explain the gap. |
| Design | A failed loop is diagnosed and fixed. |
What a student had to know to make this
That energy stored in height turns into speed, and that some is lost to friction on every run. Predicting a number and then checking it against the ride is how physics works.
NGSS MS-PS3-2 (potential energy and the arrangement of objects), MS-PS3-5 (energy transferred when kinetic energy changes) and HS-PS3-1 (a computational model of energy change). ISTE Student Standard 1.3 (Knowledge Constructor).
In short
These are project-based alternatives to the lab worksheet for grades 4 to 12. Students build a predator and its prey and test one adaptation at a time, raise the sea around an island and explain what floods first, or predict a roller coaster's speed from its height and check it against the ride, in free browser apps that run on Chromebooks with no install and no student email.
Common questions
I am not a tech person. Can I run these?
Yes. Open the finished example the day before and spend five minutes with it. Students pick up the controls faster than any adult; your part is the science, which you already know.
Do students need accounts?
Not for the one-period versions: the examples open in the browser with no sign-up. To save their own work they need a free account, and a free class holds up to 50 students with no email needed. Work is private by default, and you can open any student's projects from your class page.
Are these real simulations?
They are models, which is part of the lesson. The coaster runs real physics with friction, the island's climate follows temperature and moisture, and the creatures move by rules. Each project asks students what the model leaves out, which is a question scientists ask about every model.
Will it run on our Chromebooks?
Yes. Everything runs in a browser tab with nothing to install. Terrain Studio and the coaster use 3D graphics, which almost every computer from the last several years has; on an older machine they load more slowly.
Still have a question? Ask us, and a person will write back.
Start with a free class
Open one of the examples yourself, then set up a class and hand out the brief.