History projects students build, not just write
A report can come from anywhere. A tour of the Silk Road that a student built in class, and can walk you through stop by stop, cannot. These three projects take a unit you already teach and turn it into something students make: a guided tour of a journey, a map that argues a point with real numbers, and a building from the period. Each one has a finished example you can open right now, a one-period version for trying it out, a rubric that grades the history rather than the software, and a brief you can print.
The journey tour
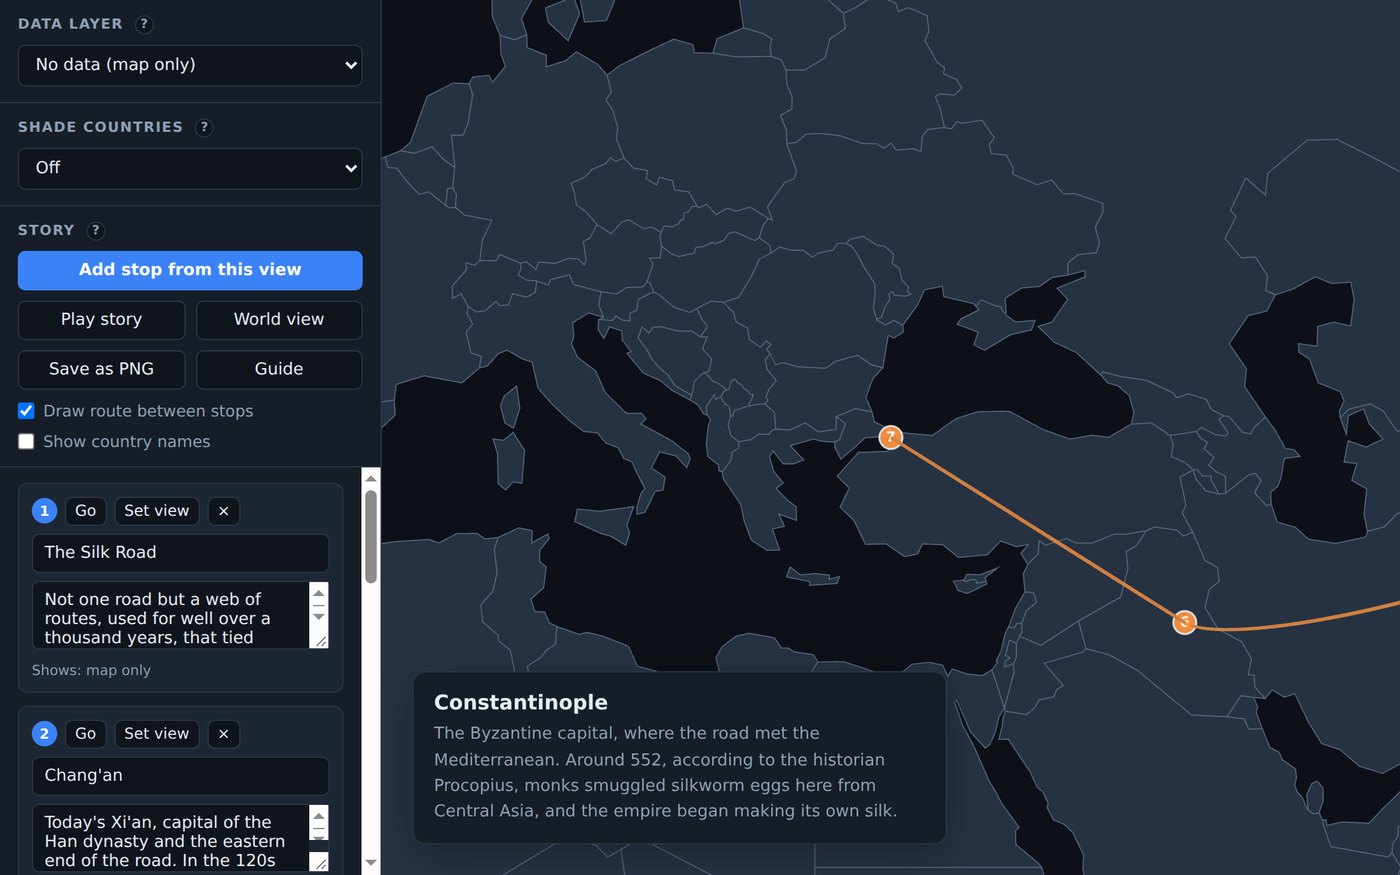
A guided tour of a journey from the unit: the Silk Road, Lewis and Clark, the Great Migration, a pilgrimage route. One stop for each place, with the map flying there in order, a caption saying what happened and why it mattered, and the route drawn between the stops. The finished tour plays by itself.
The one-period version
Everyone opens the finished Silk Road tour and plays it. Then each student adds one stop the tour leaves out, Merv or Bukhara, with a caption that argues why it belongs, and reads it to a partner.
The full project
- Pick five to eight places from your sources, in the order the journey reached them.
- For each one, find what happened there, when, and why it mattered to the journey.
- Build a stop for each place and write its caption in 60 words or fewer.
- Turn on the route, play the tour back, and fix anything that plays out of order.
- Present by playing the tour, then answer two questions from the class.
The finished piece has to answer
- Why does each stop belong in the story?
- What moved along this route: goods, people, ideas, disease?
- What changed because of the journey, and for whom?
What they hand in
The tour's share link and a list of the sources behind each caption.
Grading it: the history, not the software
| Accuracy | Places, dates and events are right, and in the right order. |
| Significance | Each caption says why the place mattered, not only what happened there. |
| Connection | The tour shows cause and effect from one stop to the next. |
| Sources | Every caption can be traced to a source on the list. |
What a student had to know to make this
Where each place is, what order things happened in, and why each place mattered. A caption that only lists facts shows the gap at once, and so does a stop the student cannot explain when the class asks.
C3 Framework, Dimension 2: geographic reasoning about movement and connections between places, and chronological reasoning about change over time. ISTE Student Standards 1.3 (Knowledge Constructor) and 1.6 (Creative Communicator).
A map that makes an argument
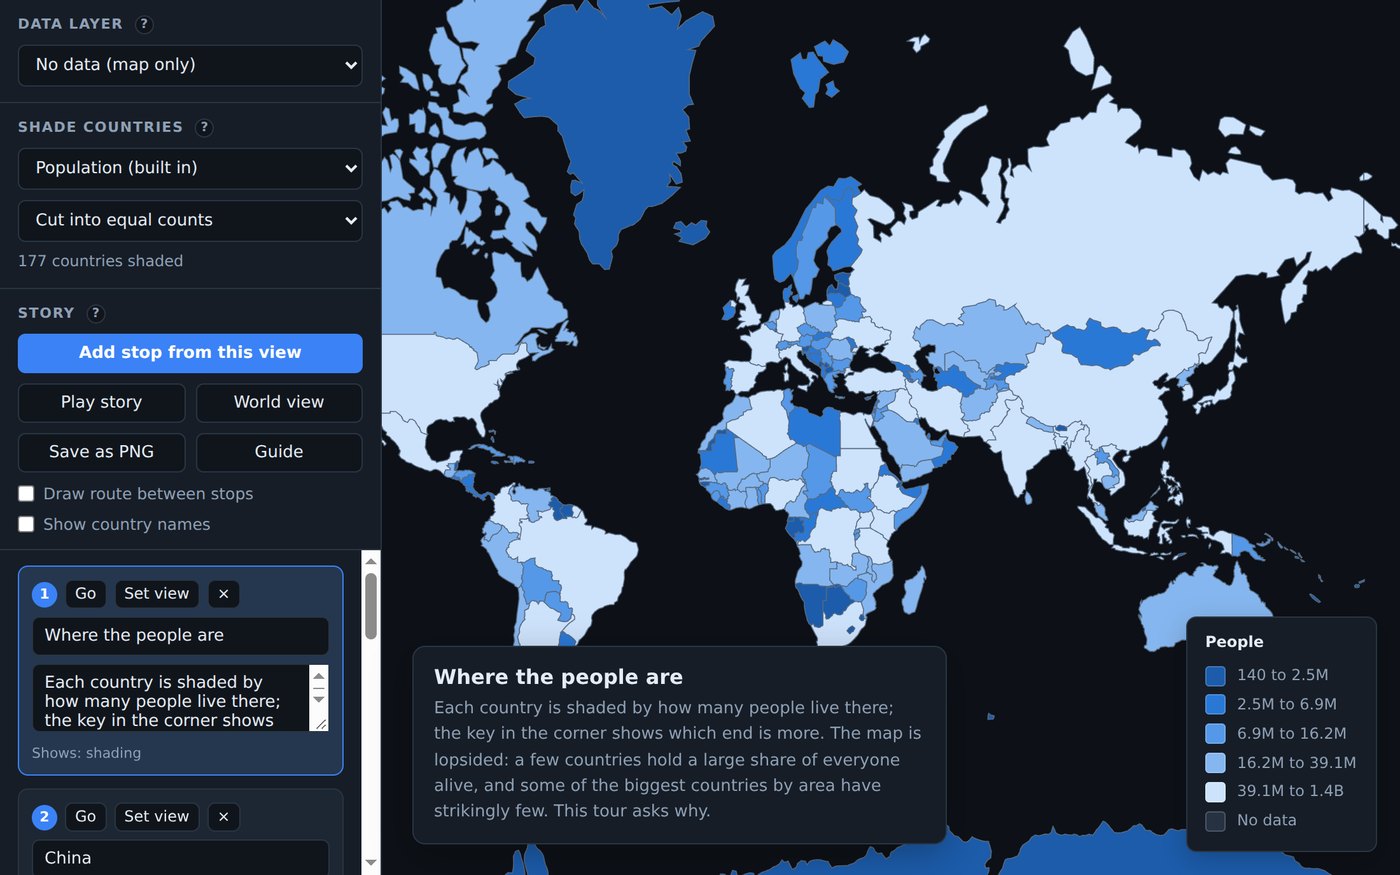
A world map shaded by a number the student looked up, such as literacy, life expectancy or access to clean water, and a short tour that makes one claim about the pattern and deals honestly with the country that does not fit it.
The one-period version
Open the finished population map and play it. Each student finds one country that fits its argument and one that does not, and adds a stop for each with a caption that explains why.
The full project
- Choose a question, for example "Why do people live longer in some countries than others?"
- Find one number for at least 20 countries from a named source such as the World Bank or the UN, and note the year.
- Paste the numbers under My own numbers, one "Country, value" line each. The app lists any country name it could not match.
- Write the claim in one sentence, then build four to six stops that support it and one that complicates it.
- Try both ways of cutting the shades, equal counts and equal ranges, and say which one you used and why.
The finished piece has to answer
- What is your claim, in one sentence?
- Which country does not fit, and how do you explain it?
- Where did the numbers come from, and how old are they?
What they hand in
The tour's share link, the data with its source and year, and the one-sentence claim.
Grading it: the history, not the software
| Claim | One clear claim that the map can actually support. |
| Evidence | The stops show the pattern, and the captions explain it. |
| Exception | The country that does not fit is shown and explained, not left out. |
| Data honesty | The source and year are given, and the shading method is stated. |
What a student had to know to make this
That a map is an argument. Choosing the number, the cutoffs and the stops is choosing what the reader will believe, and a student who can say why they chose equal counts over equal ranges has understood how maps persuade.
C3 Framework, Dimension 2 (geographic reasoning about spatial patterns and human-environment interaction) and Dimension 3 (gathering and evaluating sources, and developing claims with evidence). ISTE Student Standards 1.3 (Knowledge Constructor) and 1.6 (Creative Communicator).
A building from the period
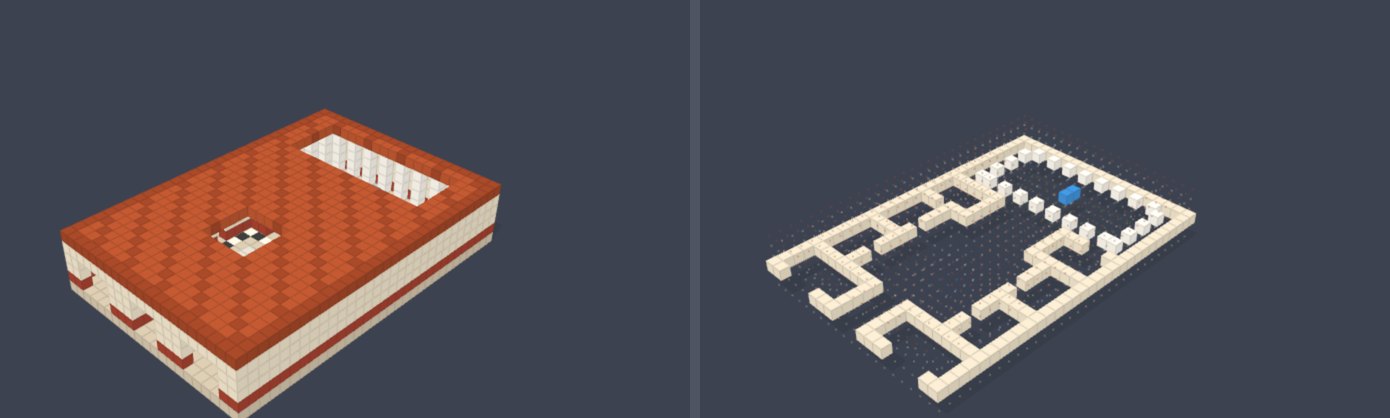
A building from the unit in 3D cubes, a Roman house, a castle keep, a longhouse, with every room placed where the sources say it was. The slice view turns the finished model into a floor plan, and the presentation is a room-by-room tour of who used each space and how.
The one-period version
Open the Roman house and turn it around. Set the slice view to a layer at wall height to see the floor plan, sketch it on paper and label each space. Then add one room that a Roman house of this size could have had, and say why it would go there.
The full project
- Find a floor plan or a written description of the building in your sources.
- Plan it on graph paper, one square for each cube.
- Build the walls first, then the rooms, then the details that show how people lived.
- Use the slice view to check the model against the plan.
- Present a room-by-room tour: who used each space, for what, and what the layout says about the people.
The finished piece has to answer
- Who lived and worked here, and where did each of them spend the day?
- What does the layout say about the family's wealth, work or beliefs?
- What did you have to guess, and why?
What they hand in
The model's share link, a labeled sketch of the floor plan, and a list of what was guessed.
Grading it: the history, not the software
| Accuracy | The layout matches the sources, and the student can point to where. |
| Daily life | The tour explains who used each space and how. |
| Honest guesses | What the sources do not say is named as a guess, not presented as fact. |
| Plan and model | The sketch and the model agree. |
What a student had to know to make this
The plan of a real building from the period and what each space was for. Building it raises questions a textbook skips, where the kitchen was, where water came from, where people slept, and the student has to answer them from sources.
C3 Framework, Dimension 2: historical thinking about how people lived in the past and using evidence to support interpretations. ISTE Student Standards 1.3 (Knowledge Constructor) and 1.6 (Creative Communicator).
In short
These are project-based alternatives to the history report, poster and slideshow for grades 5 to 12. Students build a narrated map tour of a journey, a world map shaded by real data that makes a claim, or a 3D model of a building from the period, in free browser apps that run on Chromebooks with no install and no student email.
Common questions
I am not a tech person. Can I run these?
Yes. Open the finished example the day before and spend five minutes with it. Students pick up the controls faster than any adult; your part is the history, which you already know.
Do students need accounts?
Not for the one-period versions: the examples open in the browser with no sign-up. To save their own work they need a free account, and a free class holds up to 50 students with no email needed. Work is private by default, and you can open any student's projects from your class page.
Can a student just ask an AI to do it?
Parts of it, the way they could with any assignment. But the project is built in class, in front of you, and the presentation asks them to explain each stop or room out loud. That is much harder to hand off than a written report, and much easier for you to check.
Will it run on our Chromebooks?
Yes. Everything runs in a browser tab with nothing to install. Voxel Art needs a browser with 3D graphics, which almost every computer from the last several years has.
Start with a free class
Open one of the examples yourself, then set up a class and hand out the brief.