Map Story
A map full of dots is data. A map that takes you somewhere and tells you why it matters is a story. Map Story lets students build the second kind: put real data on a world map, pick the places worth talking about, write what happens at each one, and play it back as a flight. It opens on a four-stop tour of the Ring of Fire, drawn by 1,400 real volcanoes. Play it, then add a stop of your own. Free, in the browser, no account needed to try it.
Using this with a class? Make a free class and add your students yourself: each gets a username and password, with no email or Google account needed. Or give them one join code.A first lesson: Everyone builds a three-stop story that answers one question about the map, like why so many earthquakes happen near volcanoes, and the room plays them back and judges which one made its case.
Set up a free classWhat a student actually does
They press Play story and the map flies: out to the whole Pacific with its horseshoe of volcanoes, down into Japan, along the Andes, and finally to Iceland, the exception, with a caption at each stop explaining what they are looking at. Then they drag the map to another cluster of dots, press Add stop from this view, and write a title and a sentence. Play again, and their stop is part of the tour.
From there it is a story builder. Data layers show earthquakes, volcanoes or world cities, sized by magnitude, height or population. Countries can be shaded by population or by numbers the student types in themselves. Each stop remembers its exact view and which layers were on, a route can be drawn between stops, and the finished map can be saved as a picture or shared as a story that plays itself.
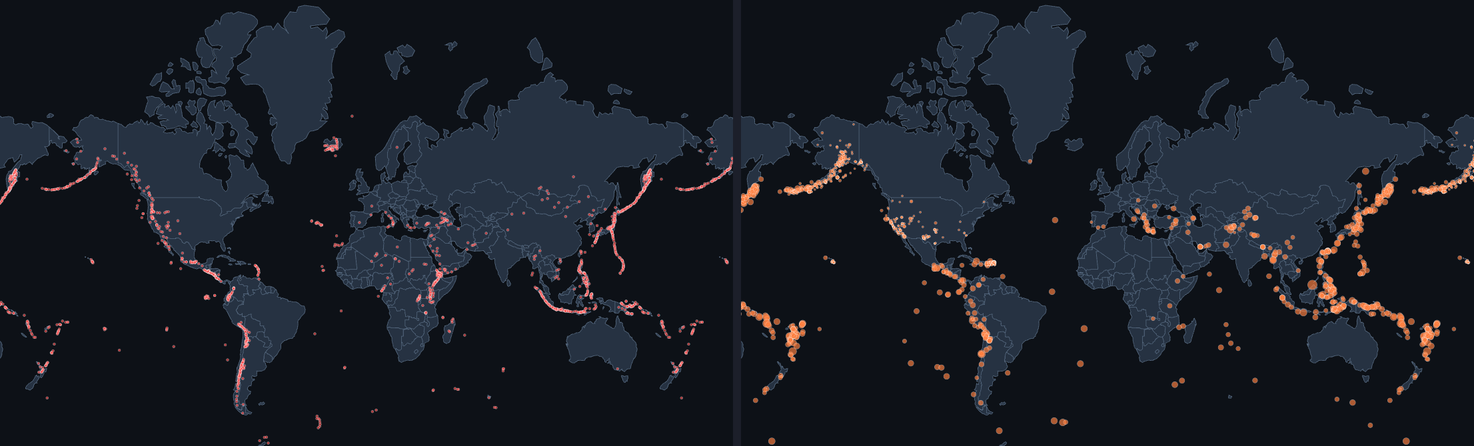
Two data layers on the same map: volcanoes on the left, a month of earthquakes on the right. They draw the same lines, around the Pacific and down the Americas, because both happen where the plates of the Earth's crust meet. Noticing that is the start of a story; Map Story is where a student tells it, one stop at a time.
What they are learning while they play
Nothing here is presented as a lesson. This is what the activity is made of.
| What the student does | What it is |
|---|---|
| Turns on the volcano layer | Spatial patterns. Plotted on a map, data shows shapes a table never would, like the ring around the Pacific. |
| Compares volcanoes and earthquakes | Plate tectonics. Both line up along the edges of the Earth's plates, where the crust is pulling apart or pushing together. |
| Writes one sentence per stop | Making an argument with evidence. Each stop points at something on the map and says what it shows. That is a claim backed by data. |
| Zooms in and out between stops | Scale. The Ring of Fire only appears from far away; Japan's volcanoes only make sense up close. Choosing the zoom is choosing what to show. |
| Reads the dots' sizes | Encoding data visually. A bigger dot means a stronger quake or a bigger city. Size, color and position all carry numbers. |
| Shades countries by population | Choropleth maps. Coloring areas by a number shows where things are concentrated, and can mislead when big countries look important just for being big. |
| Puts the stops in order | Narrative structure. Start wide, zoom into examples, end with the exception. The order is what turns a set of facts into a story. |
| Finds Iceland off the ring | Exceptions. The interesting part of a pattern is often the place that breaks it, and explaining why. |
How to tell whether it landed
Ask, and let them show you. A student who has understood it can answer these without help.
- Why do the volcanoes make a ring around the Pacific?
- Switch to earthquakes. What do you notice, and why might that be?
- Why does the story start zoomed all the way out?
- Iceland is not on the ring. What makes it the exception?
- Pick a place on the map that surprises you and make it a stop. What does your sentence say?
Practical notes
- AgesAges 9 through high school. Younger students play and add a stop; older ones build a whole argument with their own data.
- TimeUnder a minute to the first flight. A story of their own takes thirty to forty-five minutes.
- EquipmentA computer or Chromebook with a modern browser and 3D graphics (WebGL). A mouse helps with dragging and zooming. Nothing to install.
- CostFree. The app has no paid tier.
- PrepNone. Open the page and go. Reading this page first takes about three minutes.
- In a groupEveryone can build a story about the same question, and the room compares how each one argued it.
For co-ops, microschools, and classrooms
Ask one question the maps can answer, where do most people live, why are there earthquakes in Nepal, and have everyone build a three-stop story that answers it. Playing them back to the room turns geography into a set of short presentations, each built on real data.
- Real data: USGS earthquakes, Smithsonian volcanoes and world cities.
- Countries shaded by population or by numbers students enter.
- Stories play back as a flight, with a caption at each stop.
- No install, no per-seat license. Student work is private by default.
Common questions
Is Map Story free?
Yes. It runs in your browser and there is no paid tier. A free account adds saving and sharing, but nothing on this page is behind a paywall.
Does my child need an account to try it?
No. The demo on this page is the complete app with a starter story. Make a free account and the story you changed comes with you as your first project.
Where does the data come from?
Earthquakes come from the USGS Earthquake Hazards Program, volcanoes from the Smithsonian Global Volcanism Program, and cities from a public world cities list. The world map itself is public-domain Natural Earth data.
Can they use their own data?
Yes, for countries: the shading can use numbers a student types in, so they can map anything they have collected, from favorite foods to rainfall.
What ages is it for?
Ages 9 through high school. Playing and adding a stop works for anyone; building an argument with data suits older students.
What subject can I log this as?
Most families log it as geography or earth science. Plate tectonics and spatial patterns are earth science, maps and scale are geography, and writing a story with evidence is language arts. The table above lists specifically what is covered, so you can pick the label your records need and point at the evidence.
Where to go next
Start with Map Story
Trying it costs nothing and takes about five minutes. An account is what makes the work last.
Map Story is one of the making apps on the platform. It is a place to make things, not a course, and it is not a substitute for a teacher: it is at its best when an adult asks the questions above and takes the answers seriously.
Maps drawn with deck.gl. Data from the USGS, the Smithsonian Global Volcanism Program, SimpleMaps and Natural Earth. Source.
Page last reviewed September 2026.